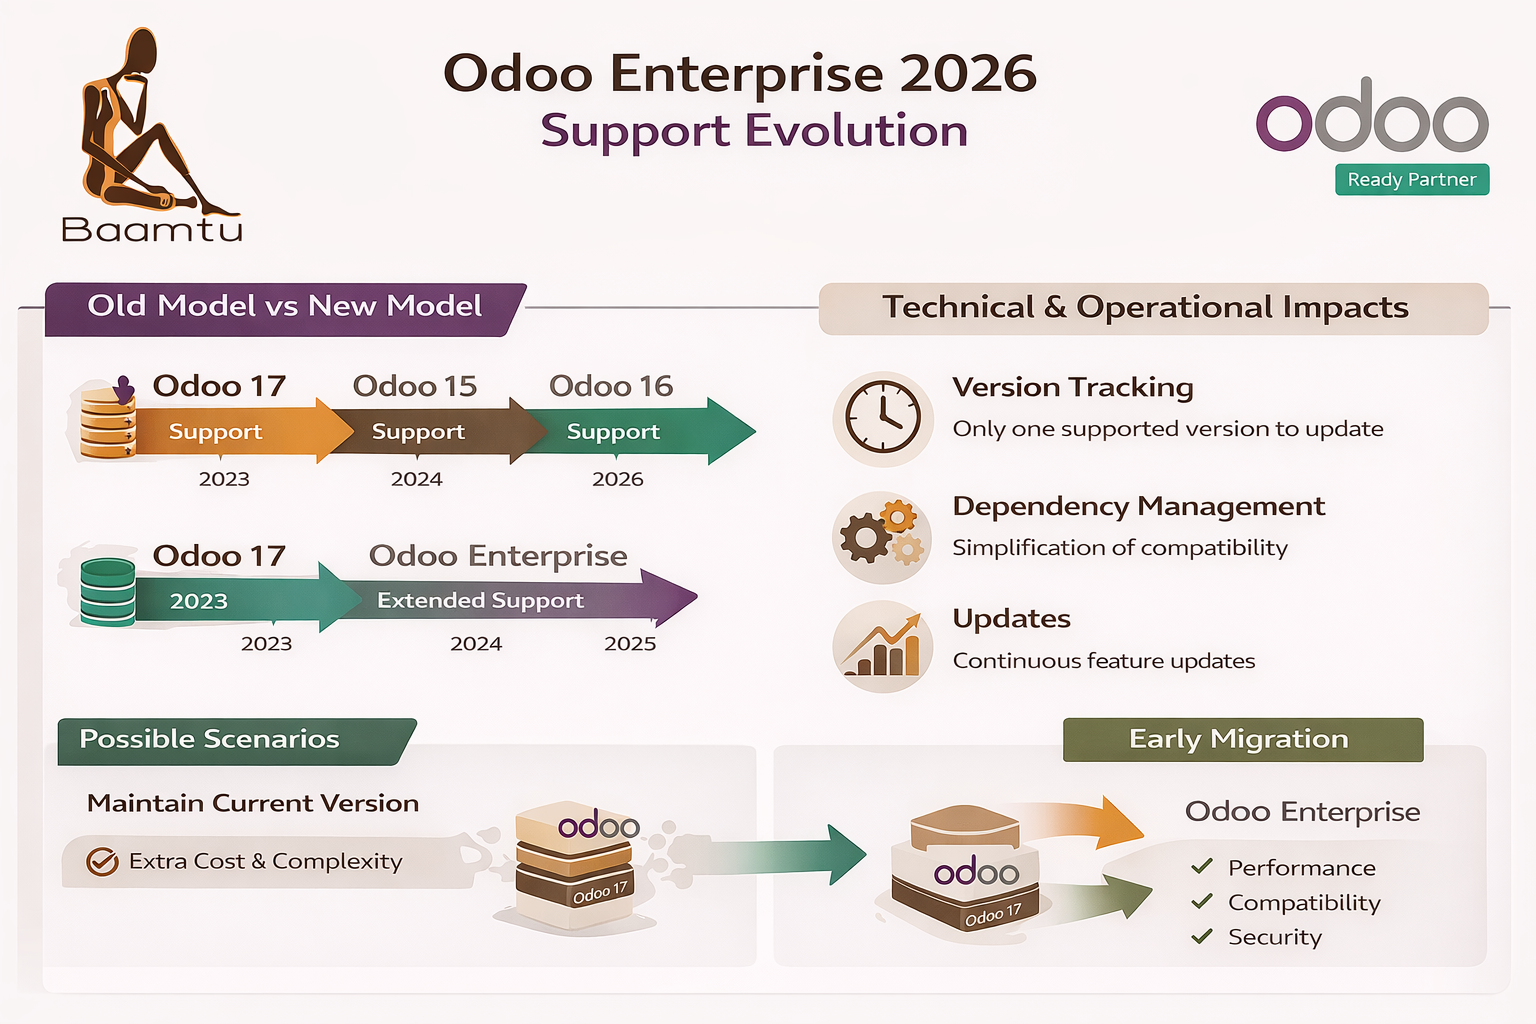
Odoo Enterprise support: technical impacts 2026
Since July 10, 2025, Odoo has announced a major change to its support policy: now, all versions of Odoo Enterprise
Read everythingMigration Odoo : Comment choisir le bon partenaire ?
Since July 10, 2025, Odoo has announced a major change to its support policy: now, all versions of Odoo Enterprise
Read everything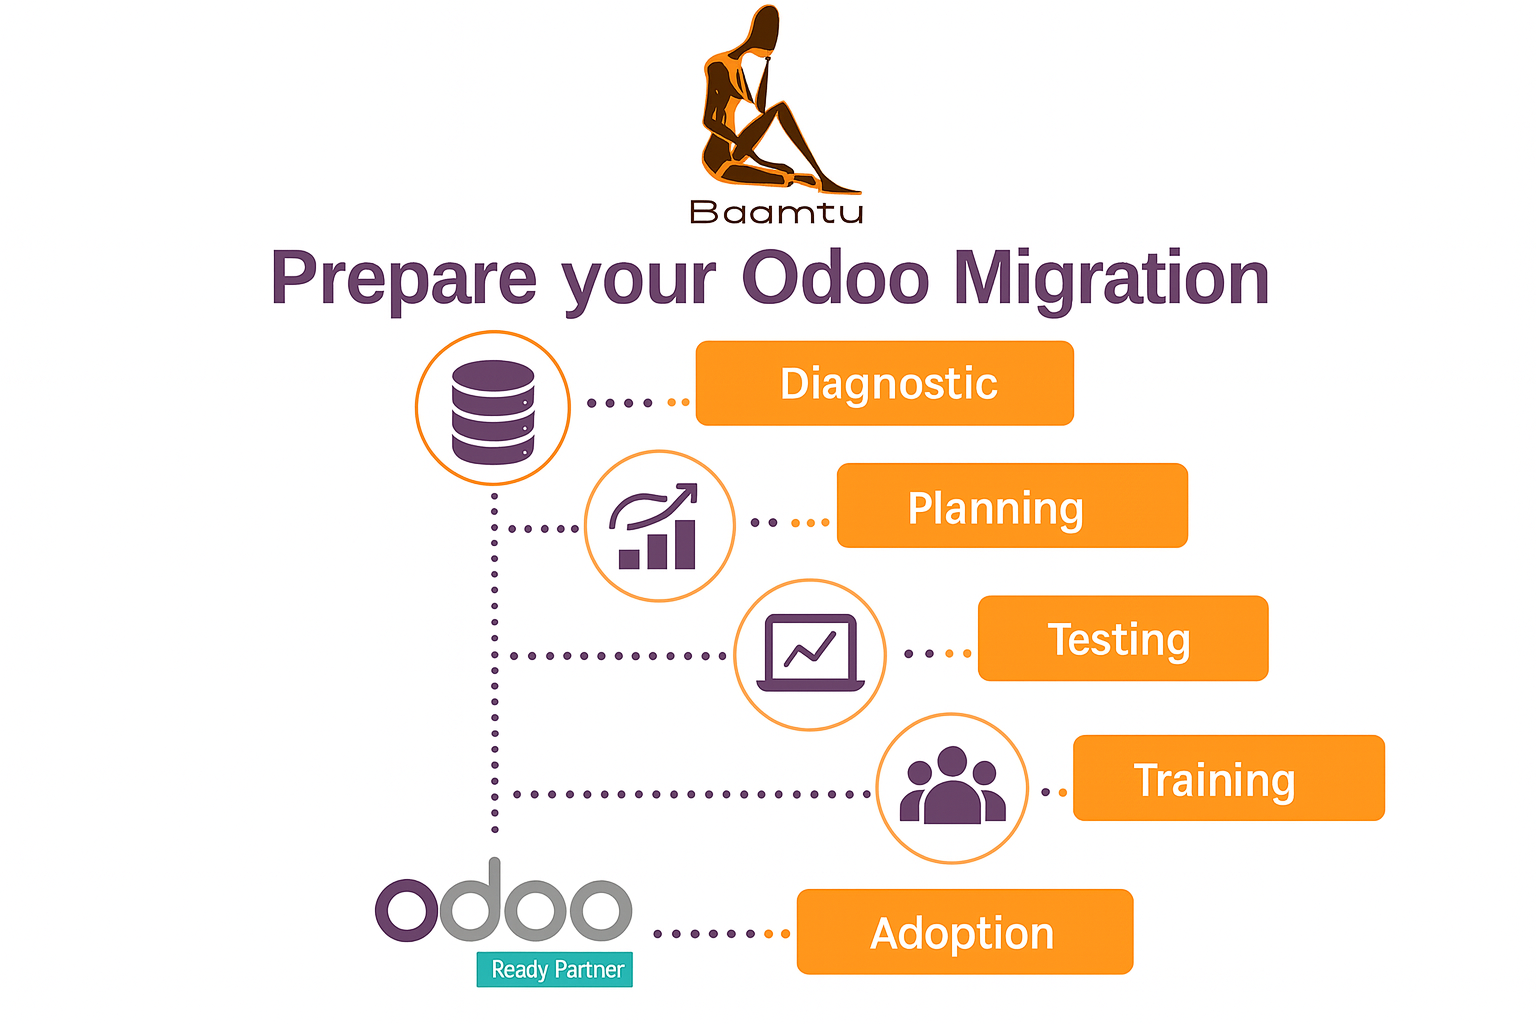
Odoo Enterprise: Prepare for migration before April 2026
Preparing for the migration to Odoo before April 2026 is necessary due to changes in support policy and the price increase...
Read everything
Odoo: the new support policy for 2026
Depuis le 10 juillet 2025, Odoo a annoncé une évolution majeure de sa politique de support : désormais, toutes les...
Read everything